Investigating an Ecosystem
This subtopic studies various ways of measuring and
investigating an ecosystem.
The biosphere is the zone of life around the Earth,
from the bottom of the deepest ocean to high in the atmosphere.
An ecosystem is a natural biological area consisting
of habitats, animals and plants. E.g. woodland, pond, river,
hillside etc.
A habitat is the set of environmental conditions in
which an organism can live.
Ecosystems are usually large and complex.
It is impossible to count every organism and habitat in
the ecosystem.
We sample the ecosystem to estimate numbers:
Netting:
A sweep net is held in a stream while the stones
upstream are kicked, organisms are swept into it.
Quadrats
A 0.5 metres square, is divided into small 5 cm
squares, it is placed at random and the plants in each square
counted.
Trapping:
Pitfall traps are placed at random, small
invertebrates fall in.
Small, baited animal traps are hidden in undergrowth,
small animals are caught.
Tree beating:
A tray or net is held under a branch.
The branch is shaken.
Insects fall into the tray or net.
All sampling techniques are subject to error:
Netting:
Creatures swim around or out of the net.
Prevent this by holding the net close to the kick and
then twist the mouth of the net over to prevent escape.
Quadrats:
Not enough coverage of the area, lack of random
placement.
Prevent this by doing as many quadrats as possible,
cover eyes to throw or place at random mathematically.
Trapping:
Creatures climb out of pitfall trap or are eaten by
predators.
Prevent this by putting lethal chemical in trap.
Tree beating:
Some creatures cling on to the surface and are not
knocked off and some can fly away.
Prevent this by covering the whole branch with a net,
examine the branch after beating and pick off remaining insects.
An abiotic factor is something in the environment that
affects the organisms living there e.g.:
Light
Soil/water pH
Temperature
Drainage
Climate
Depth of soil
Underlying rock
Flow rate of river
Depth of river
It is possible to measure these abiotic factors:
Light:
Use a light meter.
Point it at the source of the light.
Read the result off the scale and record it.
Flow rate:
Drop a ball or an orange into the river.
Measure how long it takes (in seconds) to travel one
metre.
Moisture:
Use a moisture meter.
Insert the probe into the ground.
Read the result off the scale and record it.
pH:
Use a pH meter.
Insert the probe into the ground.
Read the result off the scale and record it.
There are sources of error on all these methods:
Light:
Shadow of users falls over sensor.
Prevent by ensuring users are well back from the
sensor.
Flow rate:
The river flows at different rates across its width.
Prevent by taking several readings across the width and
calculate the average.
Moisture:
Moisture from a previous reading affects the probe.
Prevent by wiping the probe clean and dry after each
reading.
pH:
The pH from a previous reading affects the probe.
Prevent by wiping the probe clean and dry after each
reading.
Abiotic factor affect the distribution of organisms
e.g.:
Some plants grow well in bright sunlight (trees) others
grow better in shade (bluebells).
Some fish are found in faster flowing water (salmon)
others are found in stiller water (pike).
Some plants grow well in damp soil (reeds) others grow
better well drained soil (marram grass).
Some plants thrive in acid soils (heather) others thrive
in alkaline soils (primrose).
Powerpoint Revision Crossword
This sub topic examines the interactions within an
ecosystem.
An ecosystem is a natural biological area consisting
of:
Habitats.
Animals.
Plants.
The set of abiotic factors
favoured by an organism – the place where an organism lives.
A group of organisms that can
successfully breed together and produce fertile offspring e.g.
horses and donkeys are separate species because, although they can
interbreed their offspring, mules, are sterile.
The number of organisms of a
sin gle species present in an ecosystem.
All the animals and plants
present within an ecosystem.
Green plants that produce
their own food by photosynthesis.
Animals which have to eat
other organisms to live.
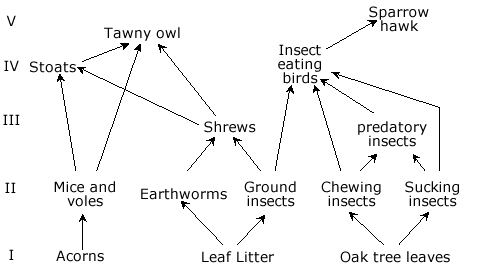
A series of organisms linked by arrows indicating the
flow of energy . Food chains do not exist in isolation in
nature, only as part of food webs e.g.:
microscopic plants
A number of interconnecting food chains e.g.:
When an organism is removed from the food web all other organisms
are affected.
Energy can be lost from a food web as movement, heat and in chemical
reactions.
The more links in a food web the more stable it is – that is a
change in the population of one organism has less effect on the
others.* see footnote
A pyramid of numbers can be constructed from a food
chain:
By counting the organisms and representing the number as the area of
a box you get:
The purpose is to represent the energy present in the
organisms at each stage:
This is not a good way of representing energy as you can
get odd results if organisms are very large or very small:
A better way of representing energy is in a
pyramid of biomass .
Biomass is the total weight of the organism in the
ecosystem.
A pyramid of biomass for the above example would look
like this:
The number of organisms in a population depends
on:
In any population where there are no limits on the size of
the population the numbers will go up and up.
The number of organisms in a population is
limited (controlled/stopped from getting any bigger) by any of
several factors e.g.:
Space.
Food supply.
Water supply.
Disease.
Predators.
Build up of toxic waste in the environment.
No population can continue growing forever.
Eventually one or more limiting factors will stop the
increase in numbers.
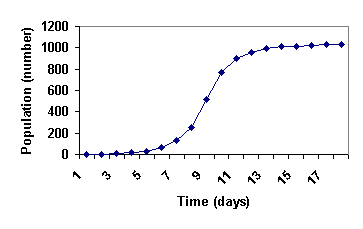
This produces the ideal growth curve:
In the first part from day 1 to 6 organism is settling in
and beginning to reproduce.
In the middle from day 6 to day 12 the population is
reproducing rapidly.
At the end from day 12 to day 19 the population is being
limited by one of the factors above.
When two organisms or populations of organisms need the same
resource there will be competition:
Space.
Food.
Mates.
Water.
Light.
Etc.
Usually the less successful population will become
extinct within the ecosystem.
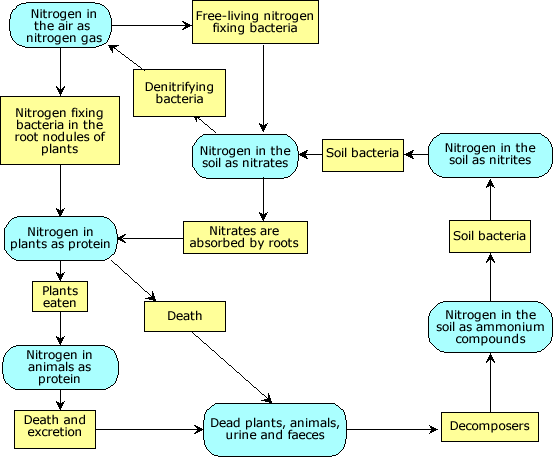
Some resources are in short supply for all organisms e.g.
carbon and nitrogen:
Nitrogen gas is common in the air but is chemically inert
and useless to most organisms.
Some species of bacteria can fix nitrogen into
useful chemical nitrates.
Some plants have nitrogen fixing bacteria living in
root nodules (swellings on the roots).
Plants can absorb nitrates through their roots to make
protein .
Animals eating the plants can convert this protein into
their own protein.
When protein is excreted or the animals die
decomposers change the protein into ammonia in the soil.
Soil bacteria convert the ammonia into nitrites in the
soil.
Soil bacteria convert the ammonia into nitrates in the
soil.
Some soil bacteria called denitrifying bacteria change
soil nitrates into nitrogen gas.
The system can be summarised as follows:
Powerpoint Revision Crossword
Control and
Management
The ability to manage the environment depends on an
understanding of the processes involved. Major areas where things
can go wrong are noted.
Pollution:
Is the addition to the environment of materials which:
Are not normally present – or in larger quantities than
are normally present.
Are harmful to the environment is some way.
Can be natural (e.g. volcanoes) or caused by human
activities.
Can affect:
Air.
Fresh water.
Sea water.
Land.
Sources of pollution are:
Domestic (from homes) e.g. sewage, refuse, car exhaust
fumes and smoke.
Industrial e.g. smoke, carbon dioxide and poisonous
chemicals:
Fossil fuels cause pollution when burned.
Coal is the worst, gas is the least damaging.
All fossil fuels release carbon dioxide
when burned:
This results in the greenhouse effect.
Heat is trapped in the atmosphere instead of passing
out to space overnight.
The world warms up.
Sea levels rise and weather patterns are disrupted
Alternative energy sources such as wind; wave,
hydroelectric and sunlight can reduce the volume of CO2
produced.
Coal and oil produce oxides of sulphur and
nitrogen when burned:
The oxides of sulphur and nitrogen dissolve in the
moisture in clouds.
This produces acid.
The acid falls as rain (acid rain ).
Fish and trees are killed.
“Scrubbers” fitted to the chimneys can remove these
chemicals but the technology is expensive and puts up energy costs.
Nuclear power stations produce no carbon
dioxide:
They do produce highly toxic and radioactive waste.
This waste will be extremely dangerous for thousands
of years.
It must be stored safely for this length of time, a
problem not yet fully solved by technology.
Agricultural (farming) e.g. fertiliser, pesticides and
slurry.
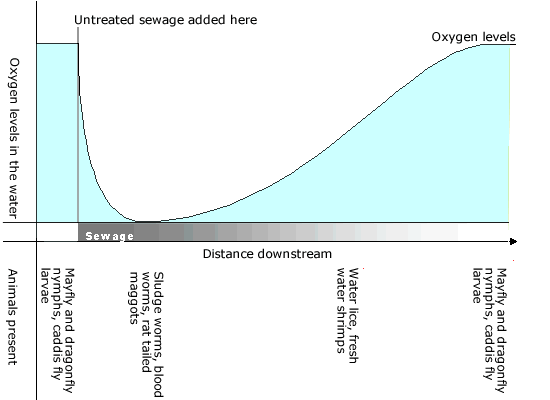
A source of fresh water pollution is untreated sewage:
Micro-organisms in the sewage use the sewage as
an energy source (food).
They multiply rapidly.
They use up the oxygen in the water for their
respiration.
Organisms that require oxygen cannot survive.
Organisms that don’t require oxygen flourish.
Further downstream the food in the sewage is used up
and gradually the river returns to normal.
Organisms that – by their presence or absence –
indicate the level of some environmental factor are called
indicator species .
All the organisms in the above diagram are indicator
species for oxygen levels.
Human beings manage the environment to produce materials to
meet our needs.
Sometimes this management, if not well thought out and
researched, can lead to problems:
Grazing too many cattle on poor land:
Plants are killed right down to the roots.
The soil is not held together.
Erosion of the soil occurs.
Leading to desertification.
Trees are cut down for ski runs:
Water flows down the hillside with no trees to stop it.
Mudslides bury the ski resorts at the bottom of the slopes.
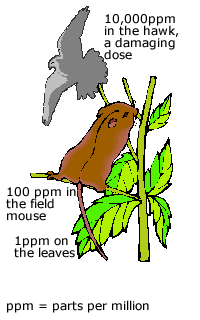
DDT is an powerful insecticide and in small
doses does not affect animals or plants:
During the 1950s and on this insecticide was sprayed on
crops to reduce insect damage.
DDT is harmless to animals in the concentrations that were
sprayed.
DDT breaks down very slowly in the soil.
Once DDT enters an animal’s body it cannot be excreted.
Whenever a small mammal eats plants covered in DDT is gets a
small dose that remains in its body.
Over many meals the levels begin to build up and up.
A predator has only to eat a few such small mammals to get a
lethal dose of DDT.
Many birds of prey died during the 50s and 60s of DDT
poisoning.
Even today DDT is still detectable in the environment.
DDT was banned in the UK and the USA in the 70s see:
http://www.chem.ox.ac.uk/mom/ddt/ddt.html .
In some parts of the world it is still used, there are
moves for a global ban by 2007 – see: http://www.guardian.co.uk/international/story/0,3604,270800,00.html .
Agriculture and forestry carry out many practices to
control the ecosystem to produce more crops, beasts and trees.
All these have potential effects for good and bad on the
ecosystem:
Agriculture:
Ploughing.
Fencing and hedging.
Draining.
Fertilising.
Use of pesticides.
Forestry:
Draining.
Laying of new roads.
Deer fencing.
Powerpoint Revision Crossword
back: